
When you select a different filter on the monitoring page (like 24 hours) and refresh the page, the graph will show the data of the previous filter, but the filter dropdown will always say 60 minutes again.
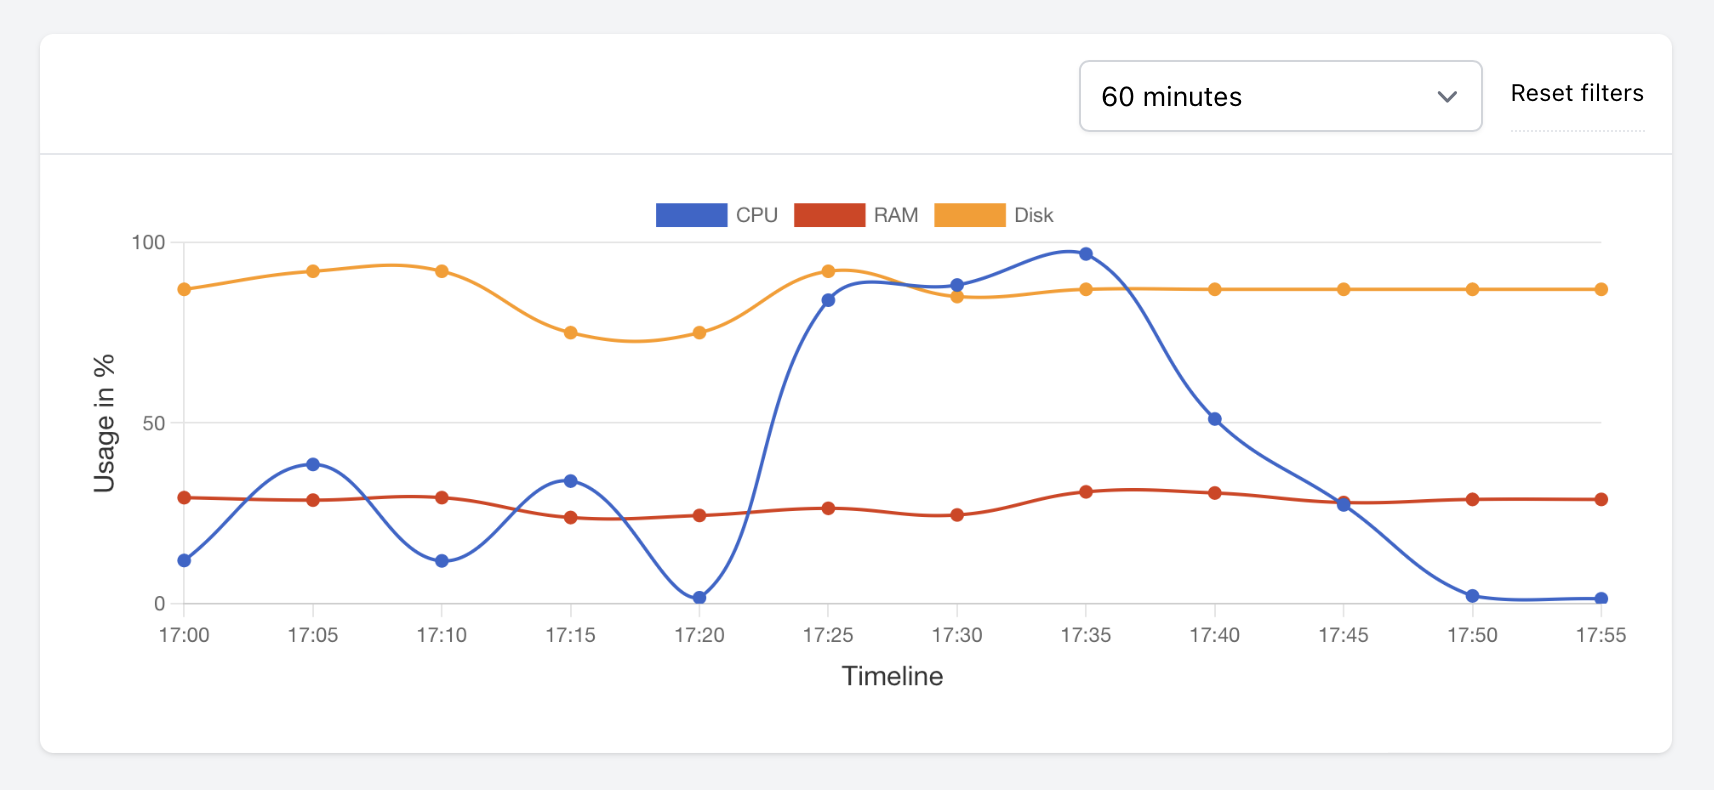
For example, this is how our 60 minutes graph looks like:
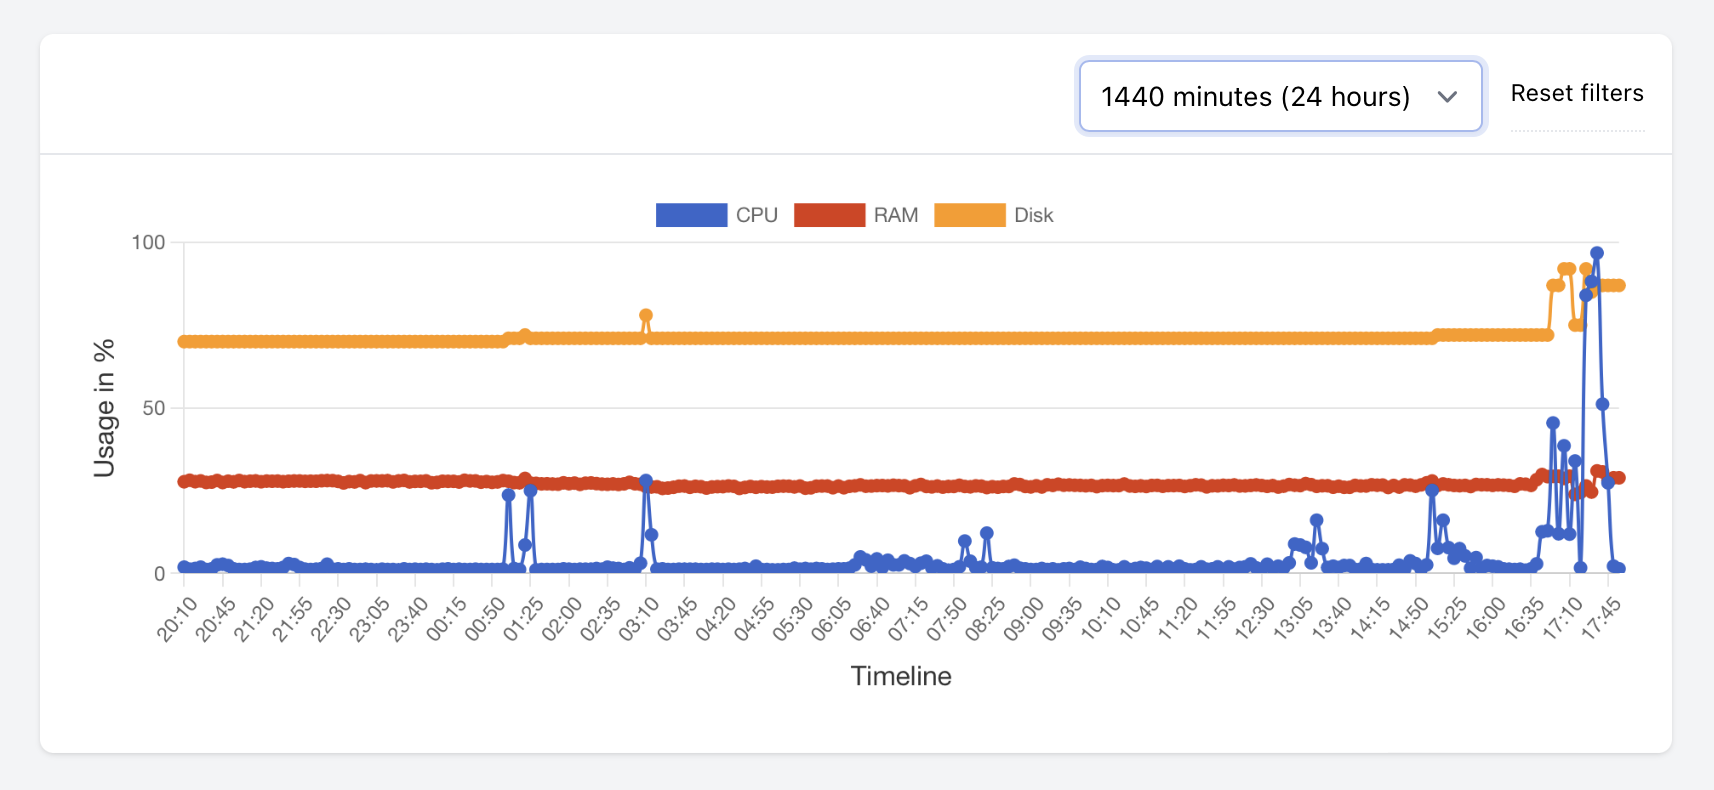
And this is how our 24 hours graph looks like:
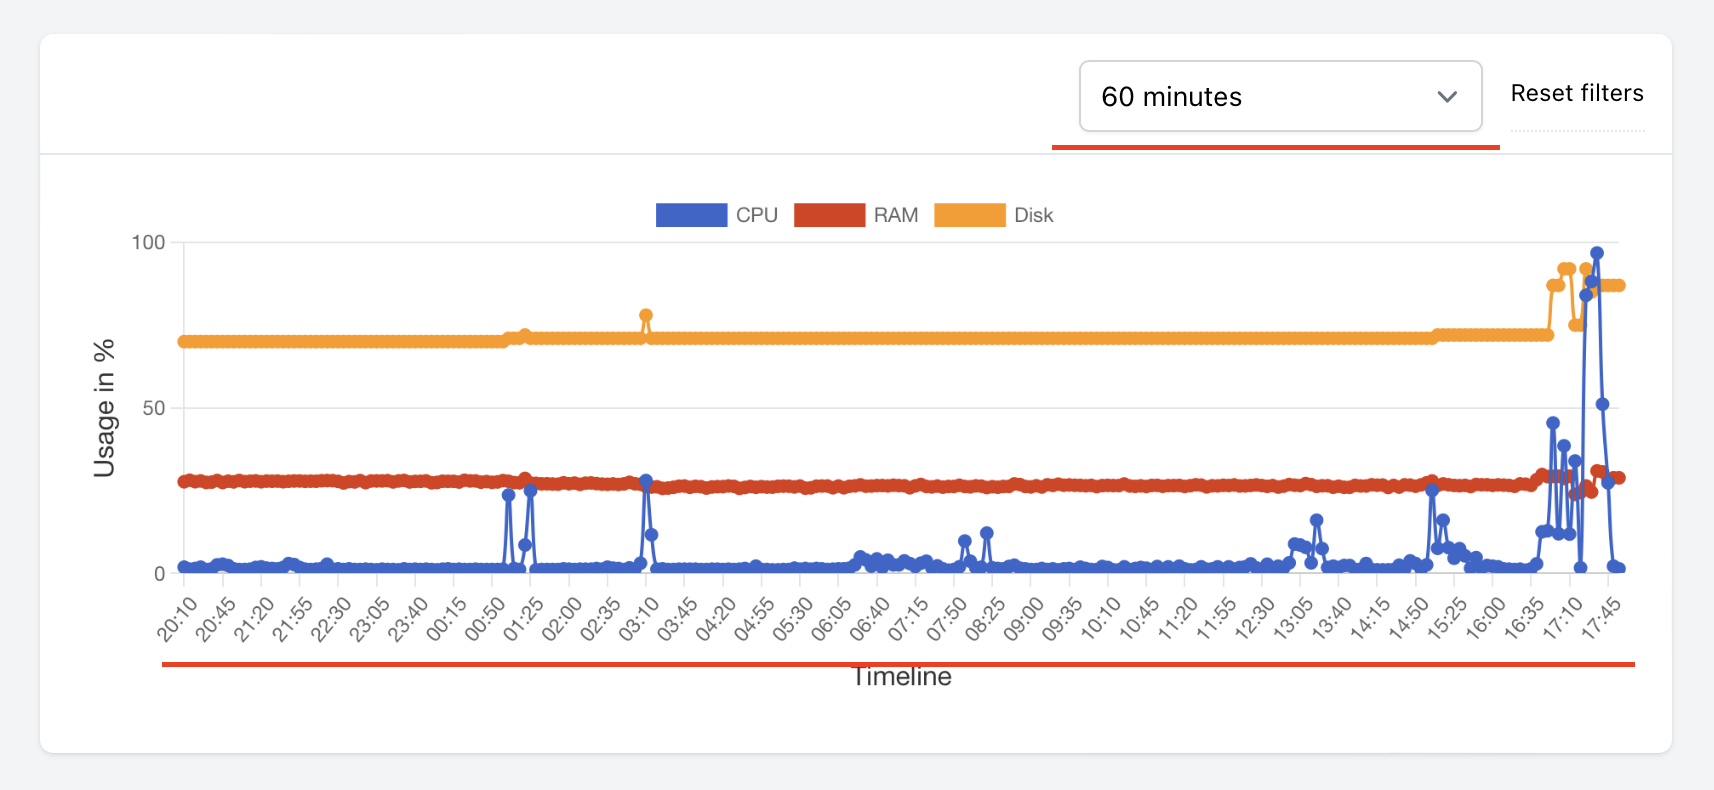
When I now refresh the page, it gives me this:
Bug: refresh Monitoring page with filters

-
Dennis moved item to board Live
3 years ago -
Dennis moved item to board In progress
3 years ago -
Dennis moved item to board Under review
3 years ago -
Ralph J. Smit moved item to project Panel Requests
3 years ago -
Ralph J. Smit created the item
3 years ago